Interesting election results in the UK over the weekend, where the Conservatives romped to victory. This was despite a widespread consensus that neither the Conservative or Labour party would get a majority. This was a triumph for uncertainty and random error over the deterministic, as none of the statistical forecasts appeared to deem such a decisive victory probable. The UK election is a lot harder to model, for numerous reasons, when compared to the US.
This means that a lot of pollsters and political forecasters will have to go back to the drawing board and re-evaluate their methods. Obviously, the models used to forecast the 2015 election could not handle the dynamics of the British electorate. However, there is a high degree of persistence within electuary constituencies. Let’s explore this persistence by looking at the relationship between coal and % Conservative (Tory) votes.
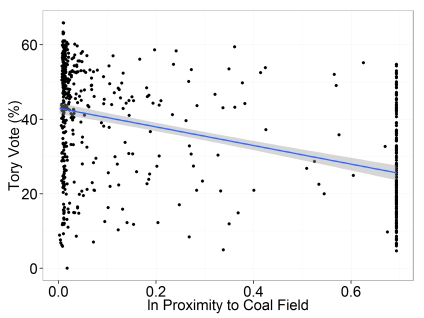
Following a tweet by Vaughan Roderick and using the methodology of Fernihough and O’Rourke (2014), I matched each of the constituencies to Britain’s coalfields creating a “proximity to coal” measure. What the plot below shows is striking. Being located on or in close proximity to a coal field reduces the tory vote share by about 20%. When we control (linearly) for latitude and longitude coordinates, this association decreases in strength, but not by much. For me, this plot highlights a long-standing relationship between Britain’s industrial revolution, the urban working class, and labour/union movement. What I find interesting is that this relationship has persisted despite de-industrialization and the movement away from large-scale manufacturing industry.
> summary(lm(tory~coal,city))

Call:
lm(formula = tory ~ coal, data = city)

Residuals:
    Min      1Q  Median      3Q     Max
-42.507 -10.494   2.242  10.781  29.074

Coefficients:
            Estimate Std. Error t value Pr(>|t|)
(Intercept)  42.9492     0.7459   57.58   <2e-16 ***
coal        -24.9704     1.8887  -13.22   <2e-16 ***
---
Signif. codes:  0 ‘***’ 0.001 ‘**’ 0.01 ‘*’ 0.05 ‘.’ 0.1 ‘ ’ 1

Residual standard error: 14.36 on 630 degrees of freedom
Multiple R-squared:  0.2172,	Adjusted R-squared:  0.216
F-statistic: 174.8 on 1 and 630 DF,  p-value: < 2.2e-16

# robust to lat-long?
> summary(lm(tory~coal+longitude+latitude,city))

Call:
lm(formula = tory ~ coal + longitude + latitude, data = city)

Residuals:
    Min      1Q  Median      3Q     Max
-44.495  -8.269   1.485   9.316  28.911

Coefficients:
            Estimate Std. Error t value Pr(>|t|)
(Intercept) 246.4355    18.9430  13.009  < 2e-16 ***
coal        -15.1616     1.8697  -8.109 2.68e-15 ***
longitude     1.4023     0.4015   3.493 0.000512 ***
latitude     -3.8621     0.3651 -10.578  < 2e-16 ***
---
Signif. codes:  0 ‘***’ 0.001 ‘**’ 0.01 ‘*’ 0.05 ‘.’ 0.1 ‘ ’ 1

Residual standard error: 12.76 on 628 degrees of freedom
Multiple R-squared:  0.3838,	Adjusted R-squared:  0.3809
F-statistic: 130.4 on 3 and 628 DF,  p-value: < 2.2e-16

Any data on how this relationship has changed over time? Do you know if it was stronger when Thatcher and Co. were shutting down coal plants?
No, but that would be interesting to see.
Do you think that a linear model is appropriate here? The response variable is constrained between upper and lower limits. Would a beta regression not better account for the properties of the data?
Perhaps it would, but I don’t need that level of rigor for a blog post!