I don’t understand why any researcher would choose not to use panel/multilevel methods on panel/hierarchical data. Let’s take the following linear regression as an example:
,
where is a random effect for the i-th group. A pooled OLS regression model for the above is unbiased and consistent. However, it will be inefficient, unless
for all
.
Let’s have a look at the consequences of this inefficiency using a simulation. I will simulate the following model:
,
with and
. I will do this simulation and compare the following 4 estimators: pooled OLS, random effects (RE) AKA a multilevel model with a mixed effect intercept, a correlated random effects (CRE) model (include group mean as regressor as in Mundlak (1978)), and finally the regular fixed effects (FE) model. I am doing this in R, so the first model I will use the simple lm() function, the second and third lmer() from the lme4 package, and finally the excellent felm() function from the lfe package. These models will be tested under two conditions. First, we will assume that the random effects assumption holds, the regressor is uncorrelated with the random effect. After looking at this, we will then allow the random effect to correlate with the regressor
.
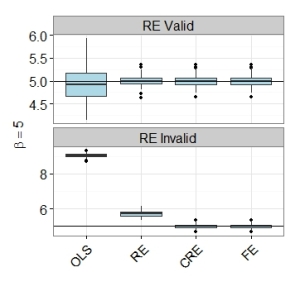
The graph below shows the importance of using panel methods over pooled OLS. It shows boxplots of the 100 simulated estimates. Even when the random effects assumption is violated, the random effects estimator (RE) is far superior to simple pooled OLS. Both the CRE and FE estimators perform well. Both have lowest root mean square errors, even though the model satisfies the random effects assumption. Please see my R code below.
# clear ws
rm(list=ls())

# load packages
library(lme4)
library(plyr)
library(lfe)
library(reshape)
library(ggplot2)
# from this:

### set number of individuals
n = 200
# time periods
t = 5

### model is: y=beta0_{i} +beta1*x_{it} + e_{it}
### average intercept and slope
beta0 = 1.0
beta1 = 5.0

### set loop reps
loop = 100
### results to be entered
results1 = matrix(NA, nrow=loop, ncol=4)
results2 = matrix(NA, nrow=loop, ncol=4)

for(i in 1:loop){
  # basic data structure
  data = data.frame(t = rep(1:t,n),
                    n = sort(rep(1:n,t)))
  # random effect/intercept to add to each
  rand = data.frame(n = 1:n,
                    a = rnorm(n,0,3))
  data = join(data, rand, match="first")
  # random error
  data$u = rnorm(nrow(data), 0, 1)
  # regressor x
  data$x = runif(nrow(data), 0, 1)
  # outcome y
  data$y = beta0 + beta1*data$x + data$a + data$u
  # make factor for i-units
  data$n = as.character(data$n)
  # group i mean's for correlated random effects
  data$xn = ave(data$x, data$n, FUN=mean)
  # pooled OLS
  a1 = lm(y ~ x, data)
  # random effects
  a2 = lmer(y ~ x + (1|n), data)
  # correlated random effects
  a3 = lmer(y ~ x + xn + (1|n), data)
  # fixed effects
  a4 = felm(y ~ x | n, data)

  # gather results
  results1[i,] = c(coef(a1)[2],
                  coef(a2)$n[1,2],
                  coef(a3)$n[1,2],
                  coef(a4)[1])
  ### now let random effects assumption be false
  ### ie E[xa]!=0
  data$x = runif(nrow(data), 0, 1) + 0.2*data$a
  # the below is like above
  data$y = beta0 + beta1*data$x + data$a + data$u
  data$n = as.character(data$n)
  data$xn = ave(data$x, data$n, FUN=mean)
  a1 = lm(y ~ x, data)
  a2 = lmer(y ~ x + (1|n), data)
  a3 = lmer(y ~ x + xn + (1|n), data)
  a4 = felm(y ~ x | n, data)

  results2[i,] = c(coef(a1)[2],
                  coef(a2)$n[1,2],
                  coef(a3)$n[1,2],
                  coef(a4)[1])
}
# calculate rmse
apply(results1, 2, function(x) sqrt(mean((x-5)^2)))
apply(results2, 2, function(x) sqrt(mean((x-5)^2)))

# shape data and do ggplot
model.names = data.frame(X2 = c("1","2","3","4"),
                         estimator = c("OLS","RE","CRE","FE"))
res1 = melt(results1)
res1 = join(res1, model.names, match="first")
res2 = melt(results2)
res2 = join(res2, model.names, match="first")

res1$split = "RE Valid"
res2$split = "RE Invalid"
res1 = rbind(res1, res2)

res1$split = factor(res1$split, levels =  c("RE Valid", "RE Invalid"))
res1$estimator = factor(res1$estimator, levels =  c("OLS","RE","CRE","FE"))

number_ticks = function(n) {function(limits) pretty(limits, n)}

ggplot(res1, aes(estimator, value)) +
  geom_boxplot(fill="lightblue") +
  #coord_flip() +
  facet_wrap( ~ split, nrow = 2, scales = "free_y") +
  geom_hline(yintercept = 5) +
  scale_x_discrete('') +
  scale_y_continuous(bquote(beta==5), breaks=number_ticks(3)) +
  theme_bw() +
  theme(axis.text=element_text(size=16),
        axis.title=element_text(size=16),
        legend.title = element_blank(),
        legend.text = element_text(size=16),
        strip.text.x = element_text(size = 16),
        axis.text.x = element_text(angle = 45, hjust = 1))
ggsave("remc.pdf", width=8, height=6)
